Two interesting books to share with you today:
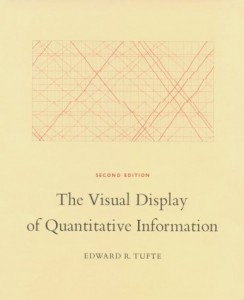
The Visual Display of Quantitative Information
Edward R. Tufte
Is a book all about charts and graphs, when they work, when they don't work, when they lie, and how to present data most effectively. The book is full of a lot of simple tricks that I've never come across as a math major, but I have to admit that he ends up with some information-dense graphs.
Unlike most non-fiction books, I read this one cover-to-cover, in one sitting. The book itself is also very attractive, printed on very nice paper. The cloud-chamber experiment on the cover is actually a railroad timetable. This is sometimes described as the Strunk and White of chart design.
How to Good-bye Depression: If you constrict anus 100 times every day. Malarky? or Effective Way?
It is the result of unchecked machine translation from Japanese to English, and that is the primary draw of the book. A self-help book for dealing with depression (and cancer?) in an unusual format–Hiroyuki's advice was first posted to a usenet group for dealing with depression, and he has chosen to reprint those conversations in full, including usenet headers and inline quotes, as the first half of the book–the book promotes healthy living (vegetarianism, pelvic floor exercises, fasting), and attempts to teach you how to deal with petty tyrants.
Maybe it even works. The advice itself isn't ridiculous, but the language makes it impossible to take seriously. Also, maybe the entire thing is a send-up. I don't know, and honestly, I only care a little. It's funny either way.


